Overview of SiDCo+
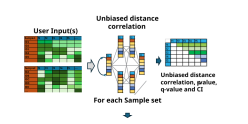
SiDCo+ (Special Improvement with unbiased Distance Correlation) calculates pairwise unbiased distance correlation coefficients [1] between all columns of a .csv datasheet as well as corresponding Chi-square p-value [2] with Benjamini and Hochberg False Discovery Rate [3] and empirical Bernstein radii [4] based confidence interval.
The primary use of SiDCo+ is in metabolomics and lipidomics although this site provides seamless application of unbiased distance correlation for any dataset.
The main advantage of distance correlation is the ability to quantify linear and non-linear correlations simultaneously, while allowing for comparisons of matrices of different dimensions through the calculation of distance covariances. Unbiased distance correlation corrects for the bias in the original distance correlation formula providing estimator equal to zero under full independence and following U-statistics providing faster calculation avenue.
SiDCo+ is implemented in Matlab and R Shiny.
Outputs are:
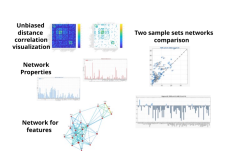
- .xlsx file which includes in different, labeled sheets: Unbiased distance correlation values, Chi-square p-values, FDR q-values, Low limit CI, High limit CI.
Visualization:
- Heatmap of unbiased distance correlation edges – both all edges and plot with edges that are statistically significant based on their q-value and low limit CI.
- Plot for Node degrees – counting edges for each node that are statistically significant based on their q-value and low limit CI.
- Plot for Node Betweenness in the network of statistically significant nodes based on their q-value and low limit CI.
- For selected features – network plot of all connected features.
If user submit two separate files for comparison of correlation networks between sample groups SiDCo+ additionally provides:
- Degree difference
- Betweenness difference
References:
- Székely, G.J., Rizzo, M.L., (2013) The Distance correlation t-test of independence in high dimension. J Multivar Anal 117:193-213.
- Shen C, Panda S, Vogelstein JT. (2022) The Chi-Square Test of Distance Correlation. J Comput Graph Stat.31(1):254-262.
- Benjamini, Y., Hochberg, Y., (1995) Controlling the False Discovery Rate: A Practical and Powerful Approach to Multiple Testing. J R Stat Soc Series B Stat Methodol 57: 289-300.
- Maurer, A., Pontil, M. (2009) Empirical Bernstein Bounds and Sample Variance Penalization. arXiv, arXiv:0907.3740.
Preparing your data for SiDCo+
SiDCo+ calculates unbiased distance correlation between features listed in columns using data across rows. The SiDCo+ input must be a single .xlsx file with features (for example metabolites or lipids) in columns and samples in rows. The file should contain column names in the top row and row names in the first column (column A). All numeric data should be below and to the right of the first column and row. If there is any non-numeric data to the right of the specified start column it will be considered as NaN. Because distance correlation calculations cannot work with data that have missing values, users should either impute missing data with a method that is the most appropriate for their dataset prior to using SiDCo+ or select to impute within SiDCo+ (using knn imputation with N=5). Similarly, user can either Normalize data externally or select to Normalize (using autoscaling) in SiDCo+.
Sample Data
The sample datasets, derived from data provided at [1], are provided in the allowed input format (.csv) with features in columns and samples in rows. Note, column A includes group names. Row 1 includes feature names.
References:
- Kalecký, K., German,D.C., Montillo, A.A., Bottiglieri, T. (2022) Targeted Metabolomic Analysis in Alzheimer's Disease Plasma and Brain Tissue in Non-Hispanic Whites. J Alzheimers Dis. 86:1875-1895.
Troubleshooting SiDCo+
When troubleshooting, please review this list of common reasons for SiDCo+ failing to run. If you are still experiencing difficulties running our tool, please contact ldomic@uottawa.ca for further assistance. Please include your input dataset and a description of the problem you experienced. We will reproduce the problem and provide you with a solution.
1. My file loads but does not output any analysis.
SiDCo+ only accepts comma-separated (.csv) files as input. Additionally, ensure that your column and row information to the right and below your start cell are numeric values. Data starts from second row and second column. Make sure that there are no missing data in your input or choose Impute in SiDCo+ as missing values will prevent SiDCo+ calculations.
2. All obtained values are zero.
Revise your tolerance, i.e., alpha and min CI. SiDCo+ sets to zero values that are below the threshold. If you prefer to see all values please enter 1 for alpha value and 0 for min CI value.
Contact us
Cite the use of SiDCo+ in a publication
Miroslava Cuperlovic-Culf, Anuradha Surendra, Irina Alecu, Finn Archinuk, Hosna Jabbari Unbiased distance correlation with the consideration of sample size dependence as a data driven network comparative analysis methodology..
Public Server
SiDCo+: https://www.insilicobiology.ca/shiny/sidco+/
Code is available: Sidco+ GitHub
Software License
SiDCo+ is free software. You can redistribute it and/or modify it under the terms of the GNU General Public License v3 (or later versions) as published by the Free Software Foundation. As per the GNU General Public License, SiDCo+ is distributed as a bioinformatic tool to assist users WITHOUT ANY WARRANTY and without any implied warranty of MERCHANTABILITY or FITNESS FOR A PARTICULAR PURPOSE. All limitations of warranty are indicated in the GNU General Public License.